Department of Conservation and Recreation Department of Conservation and Recreation

Conserve. Protect. Enjoy.
DCR Logo
Mobile Menu
Search DCR Site
Facebook Twitter YouTube Instagram LinkedIn
About DCR
 
State Parks
 
Natural
Heritage
Soil and Water
Conservation
Recreation
Planning
Dam Safety and
Floodplains
Land
Conservation
  • Soil and Water Conservation
  • Soil and Water Conservation Programs
  • Regional Offices
  • Watersheds
    • Hydrologic Unit Geography
    • Hydrologic Unit Geography Origins
    • Perennial Streams
  • Nutrient Management
    • Nutrient Management Training
      • Certification
      • Exams
      • Training Schools
      • Continuing Education
      • Presentations
    • Planner Resources
      • DCR Staff Contacts
      • Approved Soil Testing Labs
      • Nutrient Management Plan Writing App
      • Agriculture-Specific Information
      • Turf and Landscape-Specific Information
      • Hydrologic Unit Map
      • Newsletters
    • Direct Pay
    • Farm Animals Data Overview
    • Virginia Soil Surveys
    • NPS Assessment
    • Poultry Litter Program
    • Urban Nutrient Management
      • Lawn care operators
      • Fertilizer Calculator
      • Golf Nutrient Management Planning FAQ
      • Golf Nutrient Management Grants FAQ
    • VA Nutrient Management Standards and Criteria
    • Nutrient Management Training and Certification Regulations
    • VA Phosphorus Index
  • Agricultural Incentives
    • Nonpoint Source Pollution Best Management Practices
    • Virginia Cost-Share (VACS) Program
      • Agricultural Cost-share FY27 Program Overview
      • Agricultural Best Management Practices Cost-Share Manual
    • NPS Pollution Assessment and Prioritization
    • Best Management Practices Tax Credit Program
    • Conservation Resource Enhancement Program (CREP)
    • VNRCF Match Funds
    • Riparian Buffer Grants
    • Database Query
  • Conservation Planning
    • Program documents
  • Resource Management Planning
    • Developer Certification
    • Resource Management Plan Program Highlights Report
    • Links and Resources
  • Soil and Water Conservation Districts
    • SWCDs by Locality
    • Clean Water Farm Awards
    • Agricultural Cost-Share Marketing Toolkit
    • Staff and Director Resources
    • Training
      • BMP Training
      • Administration & Bookkeeping
      • Director Orientation
      • Mandatory and Recommended Courses for Staff and Directors
    • Directory
  • District Engineering Services
    • DCR Standard Drawings
    • Engineering Forms
    • Agricultural BMP Presentations and Training
    • Engineering Job Approval Authority (EJAA) Guidelines
    • Federal Watershed Dam Program
    • SWCD Dam Owner Resources
    • Workgroup Meetings
  • Shoreline Erosion Advisory Services
  • Calendar, Training Sessions
  • Soil and Water Conservation Resources
  • Resources for Farmers
  • Opportunities for Farmers of Color
  • Environmental Education
Home » Soil And Water » Nonpoint source pollution assessment and prioritization

NPS Pollution Assessment and Prioritization

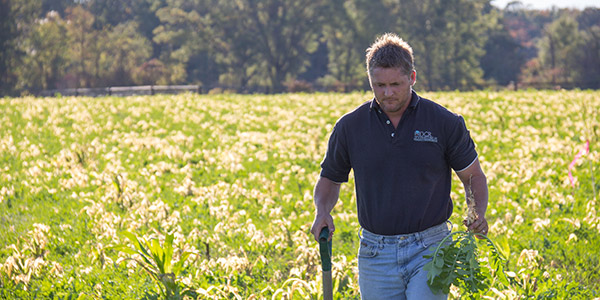
DCR employee in a field

DCR has evaluated the potential for water quality degradation due to nonpoint sources (NPS) of pollution biennially since 1986 on a per hydrologic unit basis, also taking into account indicators of where such degradation might have its greatest negative impact. The most recent assessment was conducted in 2026 for use in Program Years PY2027 and PY2028 and is referred to as the 2026 NPS Assessment.

Origins of the NPS Pollutant Loads

For the 2026 NPS Pollution Assessment, estimations of the NPS pollutant loads of Nitrogen (N), Phosphorus (P) and Sediment (S) by the sixth-level hydrologic units of the National Watershed Boundary Dataset (NWBD) have been calculated using a NPS load simulation model and data developed by the DCR, DEQ and the Virginia Polytechnic Institute and State University (Virginia Tech) Department of Biological Systems Engineering (BSE).

The voluminous statewide data requirements of the model include:

  • Land Use/Land Cover data from interpreted imagery from the Chesapeake Bay Conservancy, USDA and the Virginia Geographic Information Network. These are supplemented with: tillage practice data from DCR, the Ag Statistics for Virginia from the National Agricultural Statistics Service (NASS), grazing and manure application practices, Virginia Department of Forestry forest harvesting data and Virginia Department of Mines, Minerals and Energy mining activities.
  • Hydrologic soil groups, average water content and K factors of all soils, as reported by the USDA Natural Resources Conservation Service (NRCS).
  • Stream flows from USGS gage stations.
  • Twenty years of climate records from a multi-state area from the Climate Forecast Systems Reanalysis.
  • Growing seasons.
  • Dominant crop types by hydrologic unit from the NASS.
  • Chesapeake Bay Watershed Model output.
  • Animal headcounts from the NASS, DEQ’s AFO database, and unconfined animal distribution modeling.
  • Locations and numbers of populations not on sewer systems, from the U.S. Census, American Community Survey and the Virginia Department of Health (VDH).
  • Distribution and extent of agricultural conservation practices.
  • Slope.
  • Manure application schedules by manure type from DCR.

Much of this data was gathered in very small units - in either small cells of less than a quarter acre or as coordinate pairs (x,y) - and then aggregated into hydrologic unit level data. For the 2020 NPS Pollution Assessment and Prioritization Study, data was developed and loads calculated for 1,240 of the 1,251 sixth-level hydrologic units of the Virginia NWBD (11 units were open-water only).

Loadings were developed using the above data as well as additional data layers and a host of modeling factors (i.e. build-up rates, curve numbers, uptake rates, evapo-transpiration, dissolved pollutant factors, etc.) in the NPS load computer model. The model replicated many of the NPS pollutant producing processes and created additive estimated NPS pollutant loads from each. Those processes (load components) are:

  • Nitrogen (N) = groundwater_N + septic_N + dissolved_N + washoff_N + sediment_attached_N
  • Phosphorus (P) = groundwater_P + septic_P + dissolved_P + washoff_P + sediment_attached_P
  • Sediment (S) = summation of load for each detailed land use (see report for detailed land uses)

The edge-of-stream loads as calculated above for N, P and S were separately calculated for agriculture, urban, forest and barren land use classes as well as for non-sewered development and channel erosion. A total NPS load per hydrologic unit per pollutant is calculated by summing these NPS load components.

Best management practices (BMPs) from the Virginia Agricultural BMP Cost-Share Program (VACS), as well as from the USDA NRCS and others, were used by DEQ to reduce the estimated loads initially calculated by the model per hydrologic unit in Virginia.

Modeling performed in the NPS pollution assessment is edge-of-stream modeling. This differs from the CBPO loading estimates, which are to the fall line of each river system, and from the load reductions calculated in the Virginia Agricultural BMP Cost-Share program, which are loadings to the edge of a field.

Rankings of Hydrologic Units Using the NPS Pollutant Loads

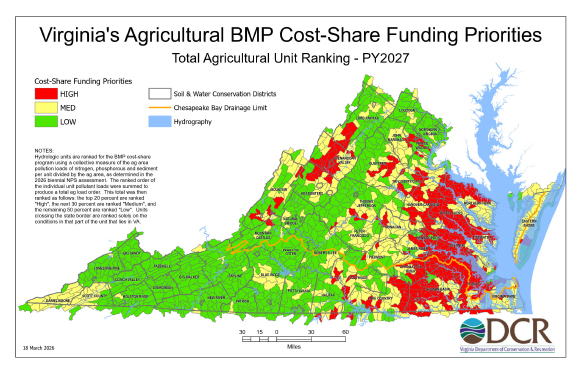
As part of each NPS Pollution Assessment, the estimated loads per pollutant per hydrologic unit are divided by the land area of the hydrologic unit to create a unit area load (UAL) per pollutant per hydrologic unit. For the purpose of targeting NPS pollutant reduction activities, hydrologic units are ranked per NPS pollutant (nitrogen, phosphorus, sediment and total) based on the UAL values of each into three categories:

  • High - units with the greatest UALs (top 20%)
  • Medium - units with moderate UALs (middle 30%)
  • Low - units with the lowest UALs (bottom 50%)

Current assessment UALs can be accessed from Agricultural Nonpoint Source Assessment Ranking and also from this map.

Virginia Agricultural Nonpoint Source Assessment Ranking
Click to enlarge.

Hydrologic Unit Prioritization

Aside from the ranking of the UALs above, other NPS pollution measures can be useful for prioritizing NPS reduction activities. Two biological assessments were also reported – an evaluation of public surface water protection needs and a modified index of biological integrity (mIBI). Likewise, two measures of the extent of impaired waters in a HU were calculated – percent of river miles impaired and percent of lakes/reservoirs acres impaired. Combined with other relevant NPS measures, evaluations of NPS conditions can help planners and decision-makers target which hydrologic units should be given primary consideration for the implementation of NPS pollution control measures. Attention should be directed to those units with higher rankings in the prioritization categories as well as those units downstream of polluting conditions.

The mIBI was produced by the Virginia Commonwealth University Center for Environmental Studies. The mIBI values are derived from more than 162,000 stream-dependent records maintained by the DCR Division of Natural Heritage, the Virginia Department of Wildlife Resources and VCU.

To evaluate the effect to the human population that depends on surface water for drinking that NPS pollution can have on a hydrologic unit basis, sources (intakes) of public surface water supplies and the population they each serve were obtained from the VDH, which has also established a standard zone of protection from these sites. This is the area where activities likely to cause water quality degradation are most likely to affect the surface water supply. This area likely differs from the area of the population served.

The impaired waters percentages were derived from impaired waters determinations made by DEQ and reported in their biannual 303d report. Impairments were evaluated to isolate those that had a nonpoint source measure and only those impairments were used in calculating the percentage of miles or acres impaired within each HU.

How the NPS Assessment Products Are Used

The Virginia Agricultural BMP Cost-Share Program (VACS) uses a customized Agricultural Nonpoint Source Assessment Ranking that uses an agricultural UAL per hydrological unit (loads/ag land) per NPS pollutant to target NPS BMP recruitment.

Virginia Department of Conservation and Recreation
600 East Main Street, 24th floor | Richmond, VA 23219-2094 | 804-786-6124
Please send website comments to web@dcr.virginia.gov
Address general inquiries to pcmo@dcr.virginia.gov
Copyright © 2026, Virginia IT Agency. All Rights Reserved
Last Modified: Monday, 3 August 2026, 01:52:12 PM
eVA Transparency Reports View the Virginia Department of Conservation and Recreation's expenditures.
Contact Us | Media Center | Privacy Policy | ADA Notice | FOIA | Jobs | Code of Ethics (PDF)
DCR Organizational Chart (PDF) | Strategic Plan (PDF) | Executive Progress Report (PDF) | Public Safety & Law Enforcement